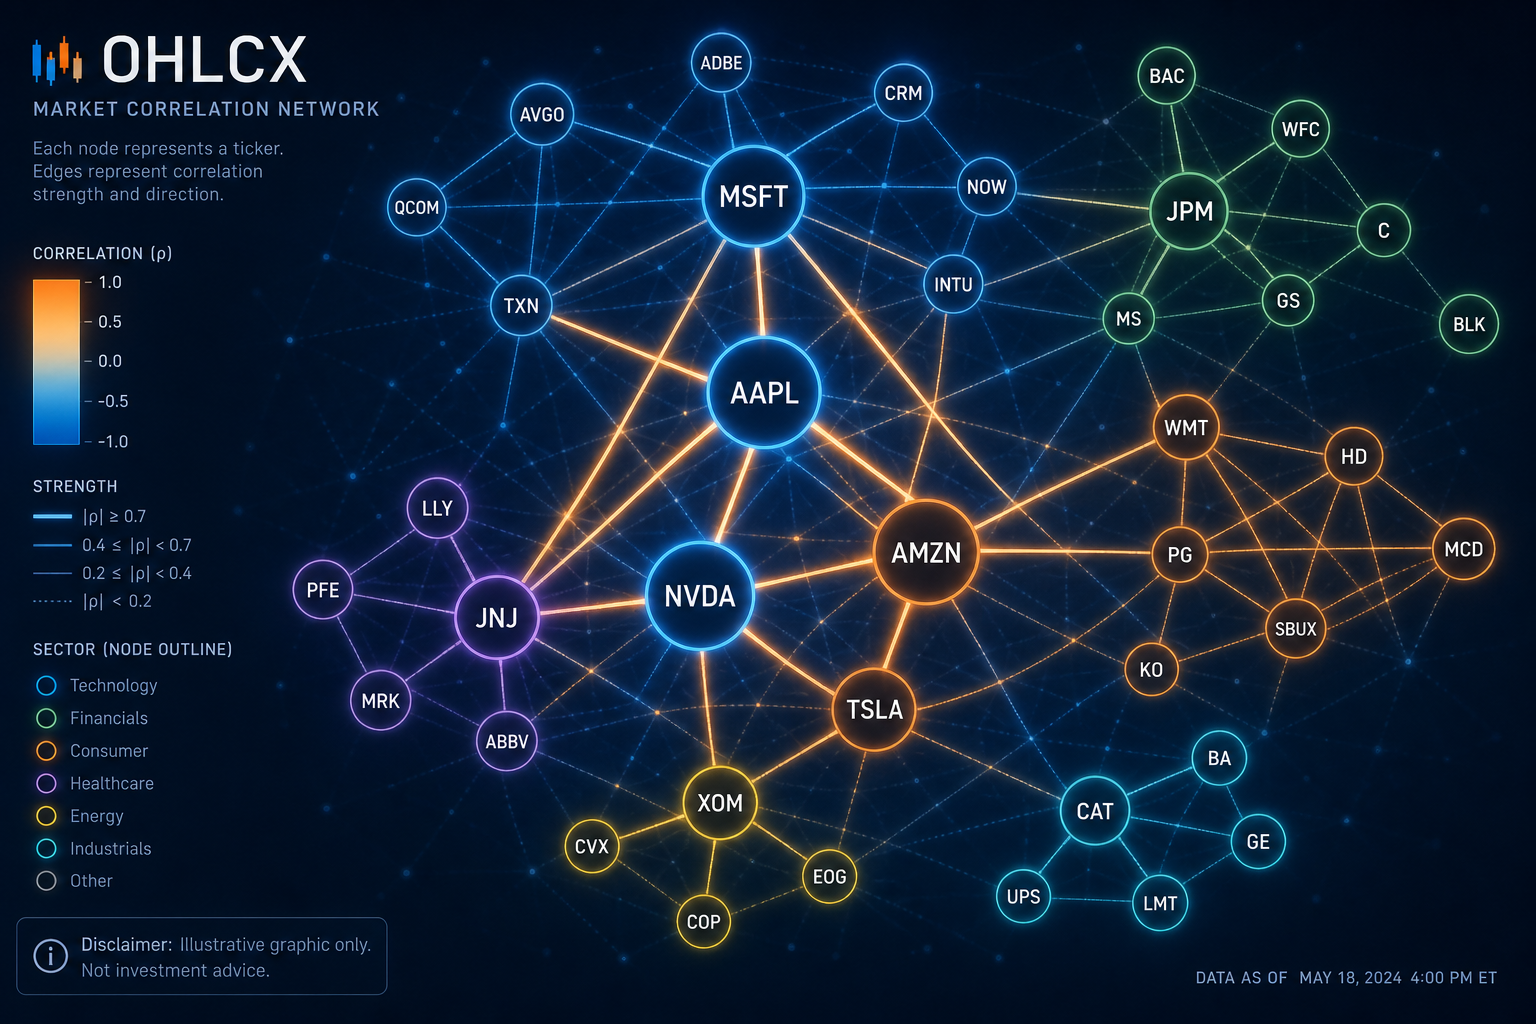
A portfolio can hold ten different tickers and still be making one trade. Semiconductors, cloud software, an AI-focused ETF, and Nasdaq calls may look diversified on separate charts. But if they all depend on lower rates, strong growth expectations, and steady risk appetite, they can move together when those assumptions change.
That is a correlation cluster: several positions linked by the same underlying driver, even when their symbols, sectors, or structures look different.
The risk often stays hidden while markets are calm. Each position appears manageable on its own, and the account looks diversified by name count. When volatility rises, those relationships can tighten. Several positions decline together, liquidity weakens at the same time, and stops begin triggering in the same window.
A risk-on book is not a personality or a market opinion. It is a portfolio that depends heavily on conditions such as easy liquidity, strong growth, tighter credit spreads, or continued demand for higher-beta assets. When those conditions reverse, modest position-level risk can become a much larger portfolio drawdown.
OHLCX can support this review by keeping positions, capital deployment, structured orders, and Risk Gauge visibility closer to the execution workflow. The platform does not determine which holdings are correlated. That judgment still belongs to the trader.
How do correlation clusters form?
Correlation clusters form when different positions depend on the same economic, market, or liquidity driver.
Some clusters are obvious. Owning several semiconductor companies creates direct sector overlap. Others are less visible. A regional bank, a commercial real estate position, and a small-cap ETF may all be sensitive to rates and credit conditions. An oil producer, an industrial company, and a transportation stock may each respond to energy prices and global growth.
Options can make the overlap harder to recognize. A call position, an equity holding, and an index ETF may look like three separate trades while creating similar directional exposure through delta and broader market beta.
Clusters can also form through ETFs. A trader may own a thematic fund alongside several of its largest holdings, effectively increasing exposure to the same companies without realizing how much weight the theme carries in the account.
The trader does not need a perfect statistical model to recognize the problem. Practical labels such as rates, credit, AI growth, energy sensitivity, small-cap beta, or broad risk appetite can reveal more than ticker count alone.
Why is ticker count a weak measure of diversification?
Diversification comes from different risk drivers, not simply different symbols. A trader can hold positions across several industries and still be concentrated in growth, rates, credit, or broad equity beta. During stable markets, those positions may move independently enough to look diversified. Under stress, their differences can shrink when the shared driver takes control.
That is when correlation matters most. Bid depth may weaken across several holdings. Positions that were expected to offset one another may begin moving in the same direction. Stops may trigger close together, forcing the trader to seek liquidity across the book at the same time.
Five positions carrying 1% of planned risk each do not necessarily behave like five independent trades. If all five rely on the same factor, losses may arrive together rather than being distributed across unrelated outcomes. The symbols are different, but the account may still be leaning on one condition.
What should a trader review before adding another position?
Before adding risk, the trader should understand what risk is already in the account. A practical review can ask:
- What macro, sector, or narrative driver does this trade depend on?
- Do existing positions benefit from the same outcome?
- Does an ETF or options position duplicate exposure already in the book?
- Are several holdings exposed to the same earnings window, economic release, or policy decision?
- If these positions move against the account together, is the combined risk still acceptable?
- Could the positions be reduced cleanly at the same time if liquidity deteriorates?
That last question matters because correlation risk is not only about price movement. It is also about several positions needing liquidity during the same period of market stress.
OHLCX portfolio views and Risk Gauge visibility can help make capital deployment, buying power use, and current positions easier to review before another order is added. They do not label the factor relationship for the trader, but they can make the account state visible while that judgment is being made.
The question before send is not merely, “Do I like this setup?” It is, “Am I adding a new trade or another version of risk I already own?”
Put boundaries around shared exposure
Correlation is not fixed, and no cap can predict exactly how positions will behave. That does not make portfolio boundaries useless.
A trader can use soft caps to limit how much risk sits in one theme, sector, event, or macro assumption. For example, adding a third position tied to falling rates may require reducing one of the existing positions first. During a macro-heavy week, the trader may allow fewer simultaneous scaling ladders across the same sector.
These controls are not claims about the perfect portfolio. They are circuit breakers for concentration and attention.
The purpose is also not to eliminate correlated trades. Concentration can be intentional. A trader may have strong conviction in one theme and choose to carry more exposure to it. The important part is that the concentration is recognized, sized deliberately, and paired with a plan for what happens if the shared thesis breaks.
Structured order entry can support that discipline by keeping size, exit logic, and account risk in view before another idea becomes a live order.
What happens when correlations tighten?
When a correlation cluster becomes active, several positions may reach pressure points together.
Stops can become synchronized liquidity events. That does not automatically mean the stops were wrong. It means the account may be trying to exit several related trades while spreads are wider and available depth is thinner.
Widening every stop because the entire cluster is under pressure can turn risk management into denial. Tightening every stop mechanically can create a different problem by forcing the full book out during ordinary volatility.
A more deliberate approach separates position-level invalidation from cluster-level risk. Individual positions may keep their original stops, while the trader also defines conditions that trigger a broader response. That response might include reducing gross exposure, closing the weakest expression of the theme, trimming the most liquid position first, or raising cash before every individual stop is reached.
This matters because each chart may still look defensible while the combined book has become too dependent on one outcome.
Execution becomes part of the cluster risk
When several related positions need to be reduced, the order path matters.
Selling everything at once may be necessary when the thesis has clearly broken and completion matters most. When time permits, however, simultaneous exits can cause the trader to compete with their own book for liquidity.
A deliberate unwind may start with the weakest factor proxy or the position with the least attractive liquidity. A liquid ETF may offer a faster way to reduce broad exposure before thinner individual names are addressed. TRIM or TRIMMER-style staged exits may fit positions where liquidity remains orderly, while a more urgent path may be appropriate when invalidation is accelerating.
Partial fills require another review. The trader may fully exit the most liquid positions but only partially reduce a thinner name, leaving the account smaller overall but more concentrated in the least desirable part of the original cluster.
OHLCX can support the unwind through structured exit flows, live position visibility, Risk Gauge review, and bulk action controls when broader exposure needs to be reduced. If the Schwab connection or order state becomes unclear during a fast move, the trader should verify working orders, positions, and partial fills before continuing.
The platform can support the mechanics. The trader still decides the sequence and urgency.
How should automation account for correlation?
Single-symbol automation can create portfolio-level concentration when each workflow operates without regard for the rest of the account.
A Strategy Builder rule may make sense for one instrument and still create a problem when similar rules fire across several related names. Individually valid setups can collectively become one oversized factor bet.
For recurring strategies, the trader should define boundaries around cluster exposure. That may include limits on simultaneous entries, smaller size after a theme reaches a set exposure level, reduced ladder depth, or a pause on new orders before a shared catalyst.
Automation should not treat available buying power as proof that the account needs more risk.
OHLCX automation is optional and rule-based. The trader defines the conditions and remains responsible for the portfolio those rules create. A repeatable workflow should still be explainable: what fired, which positions were added, how exposure changed, and whether the account remained inside the intended limits.
Monitor clusters without overengineering the process
Most traders do not need a complex factor model to improve portfolio awareness.
A regular basket review can be enough. Group positions by theme, sector, macro driver, event exposure, and directional bias. Note ETF overlap, options exposure, and the positions most likely to respond to the same headline.
The labels do not need to be perfect. Their value comes from forcing the trader to look beyond symbols.
The review should also change when market conditions change. A rate shock, widening credit spreads, an energy spike, or a shift in volatility can create new connections between positions that previously behaved independently.
One useful question captures the purpose of the exercise:
If one market assumption breaks tomorrow, which positions are likely to move against the account together?
The answer usually provides a clearer picture of diversification than counting tickers.
Review what the drawdown revealed
A drawdown can expose concentration that was difficult to see beforehand.
The post-trade review should separate the quality of the individual setups from the structure of the portfolio. Were several trades tied to the same factor? Did exits become crowded? Did partial fills leave the account concentrated in the wrong positions? Did the trader continue adding exposure after the cluster was already visible?
Order history and timestamps make that review more reliable. OHLCX can help reconstruct which orders were added, reduced, or left open as the shared factor moved.
That review should affect the next set of decisions. A theme may need a lower risk cap. A third proxy may require an entry veto. Correlated automation may need fewer simultaneous orders. An unwind plan may need clearer sequencing.
The goal is not to eliminate every correlation surprise. Relationships change, especially during stress. The goal is to reduce the number of times a diversified-looking portfolio discovers too late that it was one trade in several forms.
Count drivers, not tickers
Correlation clusters amplify drawdowns because several positions can depend on the same assumption, lose liquidity at the same time, and require exits in the same window.
The discipline is not to avoid every theme or correlated trade. It is to identify shared drivers, cap the exposure deliberately, and decide how the book will be reduced if the common thesis breaks.
OHLCX supports that workflow through structured order entry, Risk Gauge visibility, portfolio views, exit flows, bulk controls, order history, and optional rule-based automation in one Schwab-connected execution layer.
The trader still decides which risks belong in the account. The important part is making sure diversification is real before the market tests it.
Request access to evaluate OHLCX for execution-first workflows with basket-level visibility. Explore the platform to align single-name discipline with portfolio reality.
Leave a Reply