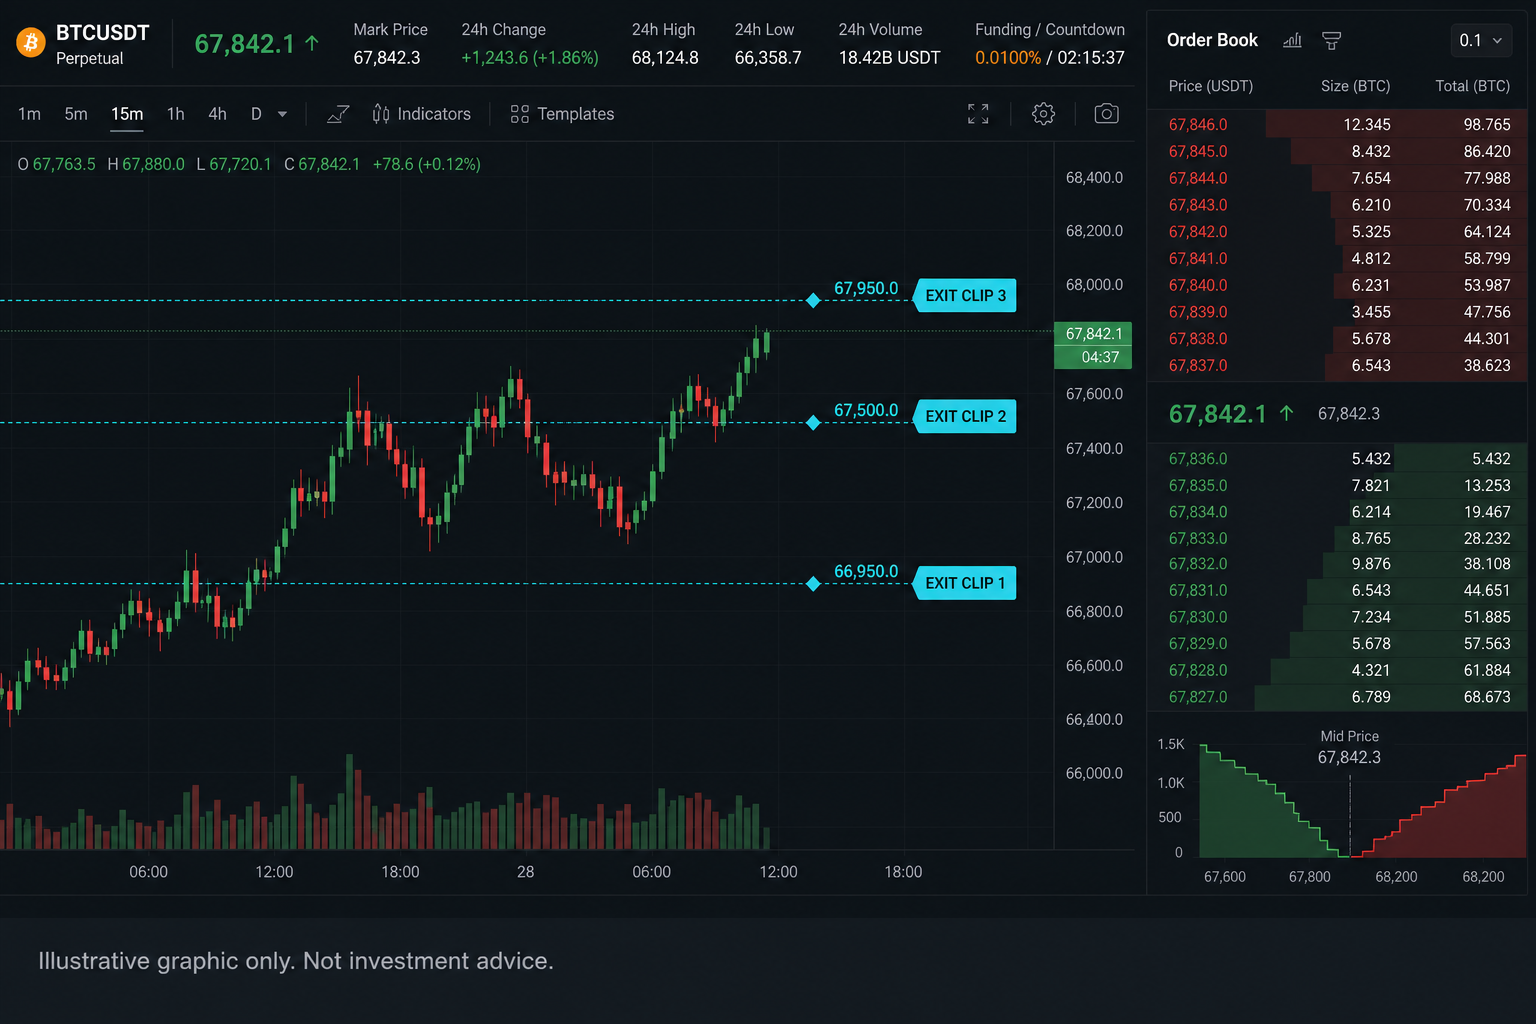
A liquidity map helps a trader answer a practical question before an exit order goes live: is there enough usable liquidity to support the exit I am planning, within the price range I am willing to accept?
That question matters because a chart only shows where price traded. It does not show whether your size could have exited there cleanly. A candle may touch your target, but the book may not have offered enough depth for your clip. A stop may trigger at the right level, but the actual fill may depend on how much liquidity is available after the trigger. A trim plan may look disciplined, but still leave part of the position behind if the spread widens or the book thins at the wrong moment.
For active traders, liquidity maps turn exit planning into something more concrete. Instead of treating a target, stop, or trim level as a single price, the trader defines an acceptable price band. Then they compare the planned exit clip against the liquidity available inside that band, using the order book, Time & Sales, spread behavior, and their own fill history.
CFA Institute describes liquidity through three useful dimensions: breadth, measured by the bid-offer spread; depth, measured by quantities available at the top of the order book and through the book; and resilience, or the market’s ability to absorb orders without moving price. Those three ideas explain why exit quality is not only about being right on direction. It is also about whether the market can absorb the order when the trader needs to act.
Liquidity problems usually show up in familiar ways. The spread widens. Top-of-book size shrinks. The book stops refreshing after trades. A level gets swept faster than expected. Hidden liquidity may or may not appear. Several correlated positions may need to exit in the same window. In options, the underlying stock may look liquid while the contract or multi-leg spread is much harder to trade.
CFA Institute’s trade-execution material also notes that market conditions at the time of trading, including intraday volume, bid-ask spreads, and volatility, should be incorporated into trade strategy because they can differ from anticipated conditions. It also identifies market impact as one of the largest potential costs in trading. That is why a liquidity map should be built before the order, not reconstructed from memory after the chart has already moved.
CMT risk-management material supports the same discipline from a different angle. Kirkpatrick separates liquidity and trend change as individual issue risks, while position sizing sits under portfolio risk. He also notes that drawdown risk requires testing all components of a system. For a trader, that means liquidity, size, exit structure, and portfolio exposure cannot be reviewed separately. The exit has to work in the actual market, with the actual position size, under the actual account conditions.
This post explains how to build that habit: define the exit price band, size the clip to the liquidity inside that band, treat Level 2 as a sanity check rather than a promise, use fill history as the better map, and plan correlated or options exits before stress forces the decision.
The goal is not to predict every print. The goal is to stop pretending every price on the chart was available to your size.
Start every exit with a price band
A liquidity-aware exit starts with a band, not a single price.
A price point says, “I want out here.” A price band says, “I want out here, but this is the range where the exit still makes sense.” That range gives the trader something real to compare against the market.
For example, a trader may want to trim a position near $50.00 but decide the exit still works down to $49.96. The working band is four cents. Before sending the order, the trader can compare the planned clip against displayed depth, recent prints, and spread behavior inside that four-cent range.
If the clip fits the band, the exit may be clean enough. If the clip would need to sweep through several levels, rely on liquidity that is not visible, or chase a widening spread, the trader has a decision to make before the order goes live.
That decision may be to shrink the clip, split it into smaller pieces, use more time, change the order type, wait for a better window, or reduce a different position first.
The band makes the exit reviewable. Without it, the trader is left comparing the actual fill against the price they wish they got.
Size the clip to the band, not the candle
A candle can make an exit look easier than it was.
Price may have touched the target, but that does not prove the trader’s full size could have exited there. The wick shows where a transaction occurred. It does not show how much size was available, how long it was available, or whether the trader’s own order would have changed the fill.
Order mechanics matter here. Investor.gov notes that a market order’s execution price is not guaranteed, that the last-traded price is not necessarily the execution price, and that parts of a large market order may execute at different prices when liquidity is not available at one price. It also notes that a limit order is not guaranteed to execute.
That is why the exit clip should be sized to the band, not to the candle.
Before sending the order, the trader should ask:
- How much displayed size is inside my acceptable band?
- How much has actually traded there recently?
- Is the spread stable or widening?
- Does size refresh after trades, or does it disappear?
- Can I exit the full clip, or should this become a staged exit?
The right answer is not always to trade smaller. Sometimes the market supports the full exit. The point is to stop assuming that every chart level is executable at every size.
Read Level 2 as a sanity check, not a promise
Level 2 and depth-of-book data can help traders read the terrain, but they should not be treated as a guarantee.
Nasdaq describes TotalView as displaying the full order book depth on Nasdaq, including every quote and order at every price level in Nasdaq-, NYSE-, NYSE American-, and regional-listed securities trading on Nasdaq. That qualifier matters. A depth view can be useful, but it is still a view into displayed liquidity within a specific market-data structure, not the entire market.
Visible liquidity can change quickly. Quotes can cancel. Size can refresh. A thick-looking level can disappear. A thin-looking book can still trade more than expected if hidden liquidity appears.
The SEC defines hidden trades as executions against undisplayed resting orders and notes that exchange feeds generally do not provide messages when undisplayed orders are added. That is why the visible book should be used with humility.
Fragmentation also matters. In a 2026 market-structure proposal, the SEC reported that national securities exchanges executed approximately 50.1% of total share volume in NMS stocks, while off-exchange market centers, including ATSs and wholesalers, executed approximately 49.9%. The book in front of the trader may be useful, but it is not the entire market.
For most active traders in liquid names, Level 2 is best used as a sanity check. It can show whether the exit looks obviously thin, whether the spread is behaving normally, and whether nearby depth supports the planned clip. But the better long-term map is the trader’s own fill history.
The book shows what is posted. Time & Sales shows what traded. Your order history shows what you actually received.
Use fill history as the better map
A liquidity map improves when it is built from actual exits, not memory.
Screenshots can help, especially when a trader is learning how a symbol behaves around certain levels or times of day. But screenshots are easy to cherry-pick. They capture what looked important in the moment, not necessarily what mattered across a large enough sample.
A better habit is to log a small number of fields consistently:
- Planned exit band
- Intended clip size
- Spread and visible depth inside the band
- Average fill price and partial-fill result
- Time to completion
That is enough to start seeing patterns. The trader can learn which names tolerate size, which windows are unreliable, which contracts need smaller clips, and where slippage starts appearing before P&L fully reflects the problem.
CFA Institute describes opportunity cost as the cost of not being able to execute all shares of an order because of adverse price movement or insufficient liquidity, and notes that trade evaluation measures execution quality. That is the reason the journal matters. It should not only record whether the trade won or lost. It should record whether the exit that was planned was actually executable.
Over time, fill history becomes the more honest map. It tells the trader what happened when their own size met the market.
Apply the band across related exits
A liquidity map should not stop at one ticker when the account is carrying one shared idea.
If several positions are tied to the same sector, factor, or theme, they may need liquidity at the same time. Each exit clip may look manageable by itself, but the group can still be too large for the same market window.
This is where liquidity maps and portfolio heat meet. The trader should ask whether the account can reduce the whole cluster if the shared driver turns.
The price band can help create that sequence. Before stress arrives, the trader can mark related positions and decide:
- Which exit has the narrowest acceptable band?
- Which position usually loses liquidity first?
- Which clip needs priority if the theme breaks?
- Which position can be trimmed instead of closed?
- Which exit can wait if the first two require attention?
This keeps the trader from making sequencing decisions while every related name is already moving.
The goal is not to turn the session into a rigid script. The goal is to know which exits are most fragile before the market tests them.
Options exits need a net-price band
Options liquidity needs its own map.
The underlying stock may be liquid while the option contract is not. Bid-ask width, open interest, volume, expiration, strike depth, implied volatility, and multi-leg completion all matter. A trader should not assume that a clean stock chart means the option exit is clean too.
For a single-leg option, the exit band should be based on the contract. For a spread or other multi-leg trade, the band should be based on the net price of the full structure.
That matters because one leg can fill while another does not. A mark can look attractive, but the complete exit may not be available at the size the trader needs. The trader needs to know whether the strategy can exit as a structure, not whether one part of it touched a theoretical price.
A useful options exit map asks:
- What is the acceptable net-price band?
- How much size is visible near that band?
- Is the spread normal for this contract?
- Is today’s volume meaningful, or is open interest carrying the story?
- What happens if only one leg fills?
- Does expiration timing change the urgency?
A hypothetical mark is not the same as an executable exit.
Stops and trails still need liquidity assumptions
A stop level is not a fill guarantee.
Investor.gov explains that when a stop price is reached, a stop order becomes a market order. It also states that the stop price is not the guaranteed execution price and that the execution price can differ from the stop price because of available liquidity when the market order executes.
That does not mean stops are bad. It means the trader should not confuse a stop trigger with a guaranteed exit price.
Trailing stops need the same discipline. A trailing rule can define when the trader wants to act, but the exit still has to trade through available liquidity. As clip size grows, a trailing exit that worked at smaller size may need a wider band, smaller tranches, or more staged reduction.
The same rule applies to all exits: the price level is the plan, but liquidity affects how cleanly the plan can execute.
How OHLCX supports reviewable exit discipline
OHLCX does not tell traders where liquidity will appear. It does not guarantee fills, reduce slippage, identify hidden orders, recommend clip size, or replace trader judgment.
What OHLCX can support is the record around the decision. The OHLCX platform connects to Schwab thinkorswim through official APIs for live order routing, account data, positions, and fills. Its architecture includes OMS/EMS order management for order lifecycle, state management, fill tracking, and event logging, with trades, events, and account actions logged for traceability.
That matters because liquidity review depends on what actually happened at the ticket. The trader needs to know what was planned, what was sent, what filled, what remained, and whether the exit behaved inside the intended band.
The OHLCX features page describes a Level 2 order book with real-time market depth and order flow, along with streaming prices, bid-ask spreads, volume, order history, CSV export, status, and timestamps. Those tools support the workflow, but they do not replace judgment. The book helps the trader read the terrain. The order record helps the trader audit what happened after the order went live.
Structured exit flows are part of the same discipline. OHLCX lists TRIMMER, OCO, TSP, Limit, and Market exit flows routed through the official Schwab API. TRIMMER splits a position into configurable tranches, OCO pairs a target with a stop-loss, and TSP uses a configurable trailing offset.
Strategy Builder can also support planned execution when exits are tied to rule-based workflows. OHLCX describes Strategy Builder as a no-code workspace where traders define entry logic, sizing, schedules, and exit flows, with automation levels for signals, trades, and live orders routed through Schwab.
The value is not that OHLCX reads the market for the trader. The value is that depth, structured exits, strategy rules, and execution records can sit closer together, so the trader is not rebuilding the exit story from memory later.
Trade the band you can actually execute
A liquidity map will never be perfect. It will not reveal every hidden order, predict every sweep, or guarantee the exit price the trader wants.
That is not the job.
The job is to make exits more honest before the order goes live. Define the acceptable band. Compare the clip to the liquidity inside that band. Check the tape. Respect the time of day. Sequence related exits before stress arrives. Then review the fill against the plan, not against the best price the chart later displayed.
Charts tell the story of where price went. Liquidity maps help the trader decide whether their size could realistically move through that path.
Explore OHLCX to see how Level 2 depth, structured exit flows, Strategy Builder, and order history can support more reviewable execution workflows.
Leave a Reply